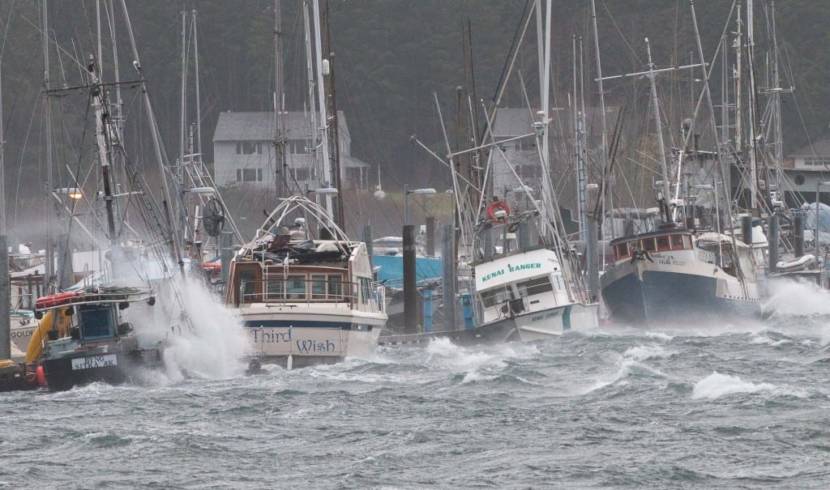
Twenty-four hours into a major autumn gale, Sitka is putting up some impressive numbers for wind and rainfall.
A slew of new instruments, however, is helping shed some light on whether this storm is producing only the usual downed limbs and trees, blowing trash cans and power outages — or if it has the potential for more serious damage.
By the look of things, rain that’s falling on one side of town is getting blown all the way to the other side before it hits the ground — or drops into one of the ten new rain gauges installed by the Sitka Sound Science Center.
Between the Science Center’s instruments — which are part of a landslide warning project under development by the Rand Corporation — and instruments operated by the United States Geological Survey, the Climate Research Network, the National Weather Service, and the state, there are 16 weather stations collecting data around Sitka, and a stream gauge on the Indian River.
But what does all this information communicate?
“We’re making good progress,” said Cora Seibert, geoscience coordinator at the Sitka Sound Science Center. “Data’s already available and now all we’ve got to do is get it in one place — and that’s a really achievable goal.”
When a storm like this one blows through, Seibert is almost certainly at her computer — well, as long as the power is on — along with the geoscience team at Rand, studying the data. And although this is all still very experimental, the news is not bad.
“The rainfall intensities for this storm are forecast to be lower than the intensities that have caused big landslides in the past,” she said.
Let’s hope that proves to be the case. The rainfall intensities Seibert sees are recorded on a website called MesoWest. It’s got the 24 hour totals for rain, along with rainfall over the last one hour, three hours, and six hours — at a variety of locations. So far, the rain gauge out by the ferry terminal is winning, with just over 5 inches of rain reported in the last 24 hours. The golf course is a very close second, and other areas around town show totals in the 3-4 inches range.
The winds are strong in this storm as well: A gust of 65 mph was recorded at the Alaska Marine Lines barge dock; a gust of 64 mph hit the airport; and a 63 mph gust slammed Sitka’s harbor.
This is some pretty rough weather, but the data shows that it’s actually a bit more intense at sea level than higher up. The Science Center’s instrument located mid-slope on Harbor Mountain recorded just over two-and-a-half inches of rain in the last 24 hours — half as much as the golf course.
This is a bit counterintuitive: We tend to think about the weather being worse at higher elevations. Seibert says that she’ll double check the temperature to make sure that freezing conditions aren’t throwing off the rain measurement.
“It looks like it’s not freezing,” she said. “It’s actually looking pretty warm. Harbor Mountain is looking like it’s 44 degrees.”
While the relatively smaller amount of rainfall on the mountains of Sitka may not be predictive of landslides, the warmer temperatures could be a problem. There’s over a meter of snow on the ridges above town. When it melts, it enters the water table just like rain.
The Geological Survey has an instrument at the top of Harbor Mountain that, among other things, measures “pore pressure.”
As much as she has her eye on rain and wind, Seibert has her eye on this measurement, which is akin to soil moisture, but relevant to landslides.
“Pore pressure goes up when water gets into soils and fills in all of the space between each grain,” said Seibert. “And then there’s so much water in there that it’s pushing the grains apart. If the pore pressure gets high enough, then the slope fails. There’s nothing to hold it up anymore, it just slops down into this mess. And so these big spikes in pore pressure are what we would be more concerned about.”
At this stage, mid-storm, the data collection is in full swing. However, no one’s drawing any conclusions about anything. That’s still to come in this multi-year project.
“All of this data is data that we’re incorporating into a dashboard,” Seibert said. “And this dashboard would be like one website that you go to that shows you how much risk there might be. You know how they do fire warnings down south? It’s Smokey the Bear, and it’s green, yellow, or red? It could be something like that. Or you could see the threshold that we’re working on with a plot that shows where we might be on the threshold. Below the threshold means you’re probably pretty safe, and above the threshold means maybe you should be concerned.”
And while Sitka is likely below that threshold for the time being, there are all the other joys of Autumn in Southeast: The falling limbs, the flooding bilges, and the tumbling trash cans.